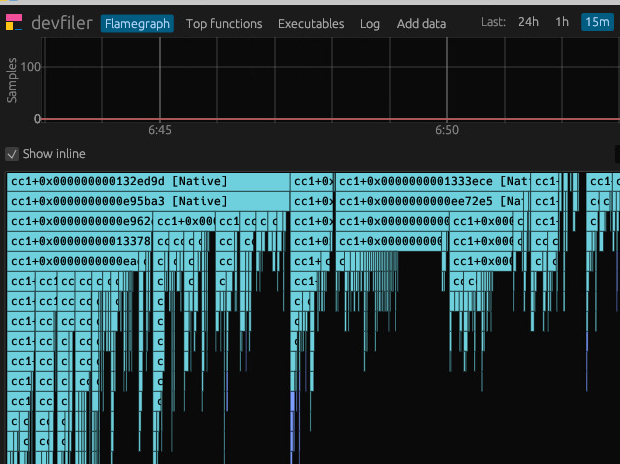
OTel profiling agent 基于eBPF,实现了全系统跨语言的性能分析器,值得一提的是,可以抓取到详细的用户态调用栈。
具有几个令人惊讶的优点:
几乎可以支持任何语言开发的目前程序,目前支持C/C++、Go等编译性语言,也支持Java、Python、Perl等解释性语言;
安全性高,实现方式不需要在目标程序能hook嵌入代码;
性能高,性能开销小于1%;
调用栈的unwind能力也很强,没有frame pointer和debug信息的情况,使用eh_frame辅助获取完整栈信息。
目前,项目迁移到这里 (贡献给opentelemetry了)。
本文简单分析下,它是如何做到的。
ubuntu上运行
version(./otel-profiling-agent -version 1.0.0)
- 启动桌面
startx, 原因是这个 - 启动devfiler
./devfiler-appimage-x86_64.AppImage - 启动agent
./otel-profiling-agent -collection-agent=127.0.0.1:11000 -disable-tls
查看加载的eBPF程序
96: perf_event  name unwind_stop  tag fae114b82570e3a6  gpl
        loaded_at 2024-08-12T06:53:10+0000  uid 0
        xlated 1912B  jited 1106B  memlock 4096B  map_ids 4136,4127,4161,4126,4154,4156,4120,4122
        pids otel-profiling-(248974)
97: perf_event  name unwind_native  tag 8cb52dc37b580f55  gpl
        loaded_at 2024-08-12T06:53:10+0000  uid 0
        xlated 30104B  jited 18718B  memlock 32768B  map_ids 4136,4127,4142,4139,4117,4152,4165,4160,4141,4124,4148,4158,4119,4132,4130,4146,4150,4166,4143,4144,4137
        pids otel-profiling-(248974)
98: perf_event  name unwind_hotspot  tag 1b16d67b1b30cdfd  gpl
        loaded_at 2024-08-12T06:53:11+0000  uid 0
        xlated 24912B  jited 16377B  memlock 28672B  map_ids 4136,4163,4127,4143,4144,4137
        pids otel-profiling-(248974)
99: perf_event  name unwind_perl  tag a1e3600b9c3977d8  gpl
        loaded_at 2024-08-12T06:53:11+0000  uid 0
        xlated 23536B  jited 15344B  memlock 24576B  map_ids 4136,4134,4127,4120,4137
        pids otel-profiling-(248974)
100: perf_event  name unwind_php  tag 6263ab26eab28b4d  gpl
        loaded_at 2024-08-12T06:53:11+0000  uid 0
        xlated 24656B  jited 15579B  memlock 28672B  map_ids 4136,4155,4127,4153,4143,4137
        pids otel-profiling-(248974)
101: perf_event  name unwind_python  tag d080953241eeff47  gpl
        loaded_at 2024-08-12T06:53:11+0000  uid 0
        xlated 27064B  jited 15995B  memlock 28672B  map_ids 4136,4167,4127,4120,4137
        pids otel-profiling-(248974)
102: perf_event  name unwind_ruby  tag 9f4542b44e98c357  gpl
        loaded_at 2024-08-12T06:53:11+0000  uid 0
        xlated 28528B  jited 18819B  memlock 28672B  map_ids 4136,4125,4127,4137
        pids otel-profiling-(248974)
103: perf_event  name unwind_v8  tag aaf69c0349b0d4a4  gpl
        loaded_at 2024-08-12T06:53:11+0000  uid 0
        xlated 27352B  jited 17008B  memlock 28672B  map_ids 4136,4135,4127,4143,4144,4137
        pids otel-profiling-(248974)
104: tracepoint  name tracepoint__sch  tag 5b45f73c7a5ca381  gpl
        loaded_at 2024-08-12T06:53:11+0000  uid 0
        xlated 832B  jited 464B  memlock 4096B  map_ids 4161,4143,4126,4127,4154,4156
        pids otel-profiling-(248974)
105: perf_event  name native_tracer_e  tag 269b8bf14315d6ed  gpl
        loaded_at 2024-08-12T06:53:11+0000  uid 0
        xlated 3104B  jited 2206B  memlock 4096B  map_ids 4136,4127,4133,4143,4161,4126,4144,4137,4154,4156
        pids otel-profiling-(248974)
eBPF代码
何时触发eBPF程序? 不同语言的栈结构是不完全相同的,是如何回溯不同的栈的?
eBPF的主要的hook点是perf_event,首先通过在每一个CPU上设置上周期执行的perf profiling事件,然后将eBPF通过ioctl绑定到perf-event上,每次perf框架驱动profiling事件时,执行eBPF程序,首先执行的是native_tracer_entry。
代码详见AttachTracer, eBPF程序主要在native_stack_trace.ebpf.c中:
- perf_event/unwind_native
- perf_event/native_tracer_entry
tracer/tracer.go 代码freg 默认20,一秒20次
// AttachTracer attaches the main tracer entry point to the perf interrupt events. The tracer
// entry point is always the native tracer. The native tracer will determine when to invoke the
// interpreter tracers based on address range information.
func (t *Tracer) AttachTracer(sampleFreq int) error {
    tracerProg, ok := t.ebpfProgs["native_tracer_entry"]
    if !ok {
        return fmt.Errorf("entry program is not available")
    }

    perfAttribute := new(perf.Attr)
    perfAttribute.SetSampleFreq(uint64(sampleFreq))
    if err := perf.CPUClock.Configure(perfAttribute); err != nil {
        return fmt.Errorf("failed to configure software perf event: %v", err)
    }

    onlineCPUIDs, err := hostcpu.ParseCPUCoreIDs(hostcpu.CPUOnlinePath)
    if err != nil {
        return fmt.Errorf("failed to get online CPUs: %v", err)
    }

    events := t.perfEntrypoints.WLock()
    defer t.perfEntrypoints.WUnlock(&events)
    for _, id := range onlineCPUIDs {
        perfEvent, err := perf.Open(perfAttribute, perf.AllThreads, id, nil)
        if err != nil {
            return fmt.Errorf("failed to attach to perf event on CPU %d: %v", id, err)
        }
        if err := perfEvent.SetBPF(uint32(tracerProg.FD())); err != nil {
            return fmt.Errorf("failed to attach eBPF program to perf event: %v", err)
        }
        *events = append(*events, perfEvent)
    }
    return nil
}
interpreter确定
不同语言的栈又是如何回溯的呢?
用户态Golang程序在程序加载时,接收到内核通过eBPF发过来的事件,对目标程序的各个内存区mapping,找到对应的加载器(比如elf中的ld entry),并将结果再存到eBPF map中供eBPF程序使用。查找interpreter是很慢的操作,不适合用eBPF实现。
用户态processManager负责管理使用哪个interpreter主要的代码流程如下:
handleNewMapping
   AddOrIncRef
      detectAndLoadInterpData

   handleNewInterpreter
eBPF程序首先进入的是统一的入口,native_tracer_entry, 然后根据interpreter信息,通过tailcall的方式调用各自语言的eBPF程序,unwind_ruby, unwind_pyth ....
栈回溯 - unwind
frame point存在(有rbp), 这种情况下回溯是比较简单的:
If the binary has been compiled with a frame pointer register, then identifying where the return
address has been stored and recursively walking the stack is simple: for example, the x86_64 ABI
specifies that the frame pointer register is rbp, that the return address of the current frame is stored
at the address pointed by rbp+8, and that the base pointer of the previous frame is stored at the address pointed by rbp.
frame pointer是可以去掉的,栈的维护并不依赖它,通过rsp和当前frame的长度就可以回到上一个frame。
gcc有个编译参数可以去掉fp – -fomit-frame-pointer. 缺少FP的情况,OTel profing agent 使用了eh_frame信息回溯。
eh_frame信息也是用户态Golang准备好的,就是项目中的stack delta.
这篇paper介绍了怎样用eh_frame恢复调用栈。
文档信息
- 本文作者:seamaner
- 本文链接:https://seamaner.github.io/2024/08/12/elastic-otel-profiling-agent/
- 版权声明:自由转载-非商用-非衍生-保持署名(创意共享3.0许可证)